


SPX Daily Levels For Tuesday 7/1/2025 🎯
SPX support and resistance levels for Tuesday

Levels for Tuesday are in the chart and listed below:
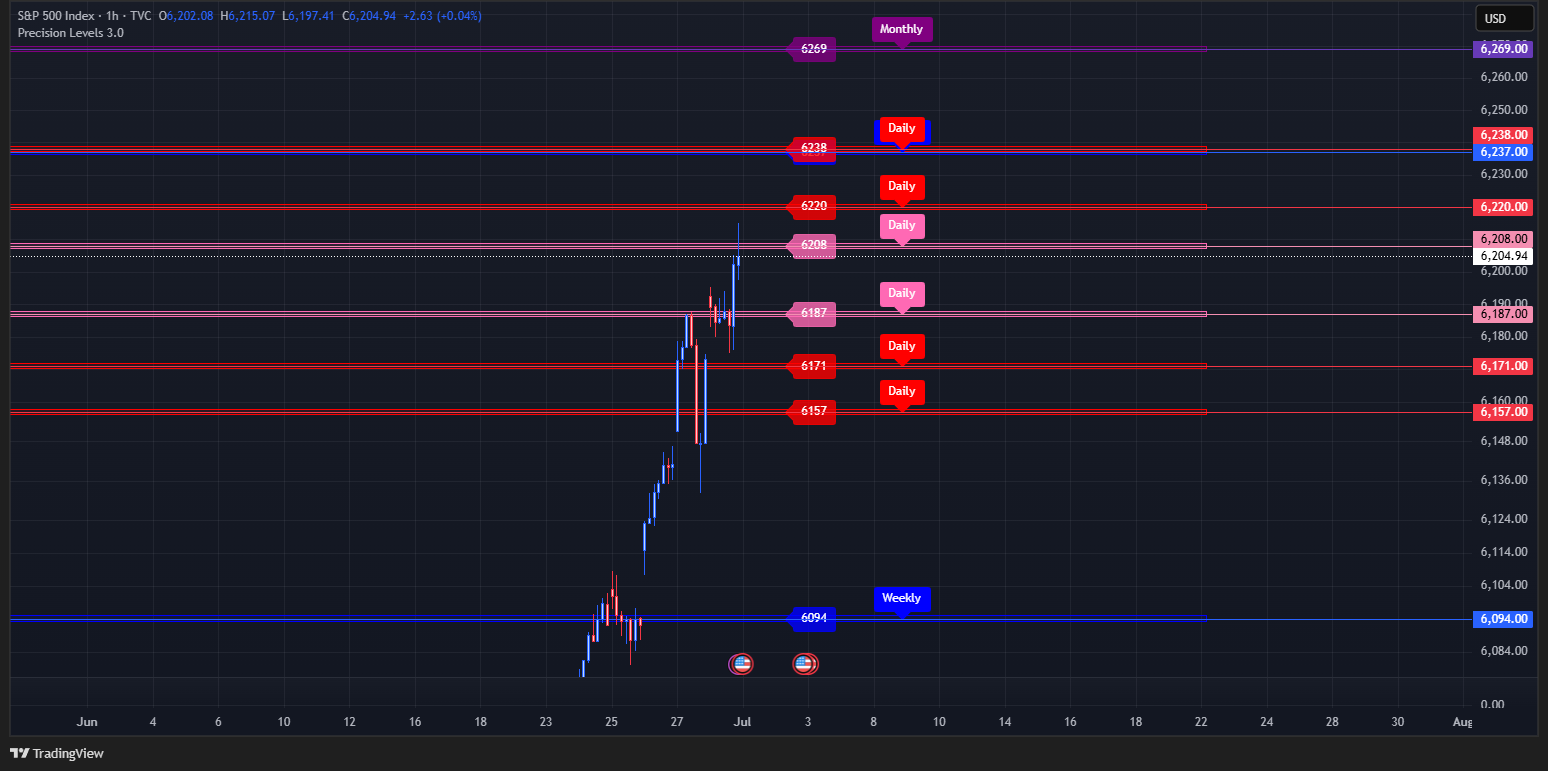
🎯 Daily SPX Levels:
6238-Red
6220-Red
6208-Pink
6187-Pink
6171-Red
6157-Red
🎯 Weekly SPX Levels:
6237-Blue
6094-Blue
🎯 July SPX Monthly Range:
6269, 5830 -Purple
🎯 String Input: Copy and Paste this into the Indicator
6238,6220,6208,6187,6171,6157,6237,6094,6269,5830
Red and Pink Levels are updated Daily. (Daily Levels)
Blue Levels are updated Weekly before Mondays open. (Weekly Levels)
Purple Levels are updated beginning of each Month. (Monthly Range)
If necessary, I will provide additional daily levels in Substack’s chat thread to account for market gaps.
Levels Converted to ES Below:

🎯 Daily ES Levels:
We are now using September Contract.
Manual ES Spread= 50
6288-Red
6270-Red
6258-Pink
6237-Pink
6221-Red
6207-Red
🎯 Weekly ES Levels:
6287-Blue
6144-Blue
Levels Converted to SPY Below:

🎯 Daily SPY Levels:
Manual SPY Ratio: 10.042
621.19-Red
619.4-Red
618.2-Pink
616.11-Pink
614.52-Red
613.12-Red
🎯 Weekly SPY Levels:
621.09-Blue
606.85-Blue
📣 Key News Events This Week:
But first here is how I treat news events. Rather than attempting to forecast where the market will head during these news events, I see them as moments when market algorithms swiftly push prices in their intended direction, regardless of the news itself. As traders, we can’t reliably predict how the market’s emotions will interpret good or bad news—sometimes it defies logic entirely. Good news might trigger sell-offs, while bad news could spark rallies. Instead of guessing, we should focus on reacting to live price action, letting it guide us based on how it aligns with our technical analysis.
Tuesday, July 1, 2025:
09:30 Fed Chair Powell Speaks
09:45 S&P Global Manufacturing PMI
10:00 ISM Manufacturing PMI
10:00 JOLTS Job OpeningsWednesday, July 2, 2025:
08:15 ADP Nonfarm Employment Change
10:30 Crude Oil InventoriesThursday, July 3, 2025:
Holiday United States - Independence Day - Early close at 13:00
08:30 Average Hourly Earnings
08:30 Initial Jobless Claims
08:30 Nonfarm Payrolls
08:30 Unemployment Rate
09:45 S&P Global Services PMI
10:00 ISM Non-Manufacturing PMIFriday, July 4, 2025:
All Day Holiday United States - Independence Day 🎇
📊 Here are charts of the larger patterns I’m watching below:
Hourly Chart From 6/29: There’s a confluence of the previous all-time high trendline and channel resistance from 6,230-6240 expected to hold throughout Tuesday. A rejection at this level could push the price toward the channel’s midline. That said, I don’t depend solely on trendlines—they are just one element I combine with my algorithmically generated support and resistance levels to create a comprehensive analysis. Note that this assessment is based on June 30th, 2025, and upcoming events like Fed Chair Powell's speech on July 1 could influence market movement. Always base your trades on the market's current conditions, not on predictions.

Daily Chart From 6/29:

Weekly Chart From 6/29: This is a weekly log scale chart of the S&P 500 dating back to 2009, which showcases its typical bullish pattern over the years. The chart indicates there’s still significant room for the price to move both upward and downward from its current level. It’s common for analysts to predict market tops when new all-time highs are reached, but based on this long-term view, the market doesn’t appear overextended. A hidden trendline at 0.75 of the rising channel aligns with a level of 6,320 for July, offering a key reference point. When studying a channel, you can identify support and resistance at the top, middle, bottom, and even fractional increments in between. Additionally, there’s a yellow rising wedge pattern visible below, but the recent upward surge makes me question the reliability of the lower trendline, especially since the price has already broken through it once.

📣 Announcement:
Indicator Update: I’m thrilled to announce Precision Levels 3.0, an updated version of my custom indicator I’ve developed for Trading View, now available in the Community Scripts section! This tool is designed to streamline your charting by semi-automatically highlighting the key price levels I share, making it easier to track critical support, resistance, and breakout zones. Visit the link below for a step-by-step guide on how to find, set up, and use this indicator in your Trading View charts.

👇 Below are Hyperlinks to previous content shared in this newsletter. I recommend reading through all of it to better understand how to use this information to secure your edge:
Overview of the Quantitative Algorithm
A Day Traders Guide to Using Support and Resistance


Disclaimer
All content provided by Precision Levels SPX, including but not limited to website materials, social media posts, videos, charts, technical analysis, and other communications, is for informational and educational purposes only. It does not constitute financial, investment, trading, or professional advice of any kind. Precision Levels SPX is not a regist…