


SPX Daily Levels For Tuesday 7/8/2025 🎯
SPX support and resistance levels for Tuesday

🏖 I’ll be on a family vacation from Friday, July 11th, through Saturday, July 19th, 2025. During this time, I may not be able to produce a full newsletter for the week of July 14th–18th, but I’ll continue sharing the algorithmic systems levels via cell phone screenshots. Each newsletter will include the ES spread and SPY conversion ratio, though I won’t be posting ES or SPY charts. My goal is to keep updates brief to balance family time while maintaining the daily precision subscribers value. Normal newsletter structure will resume on July 20th. Thank you all for your continued support of this newsletter’s launch. I’m truly grateful!
Levels for Tuesday are in the chart and listed below:
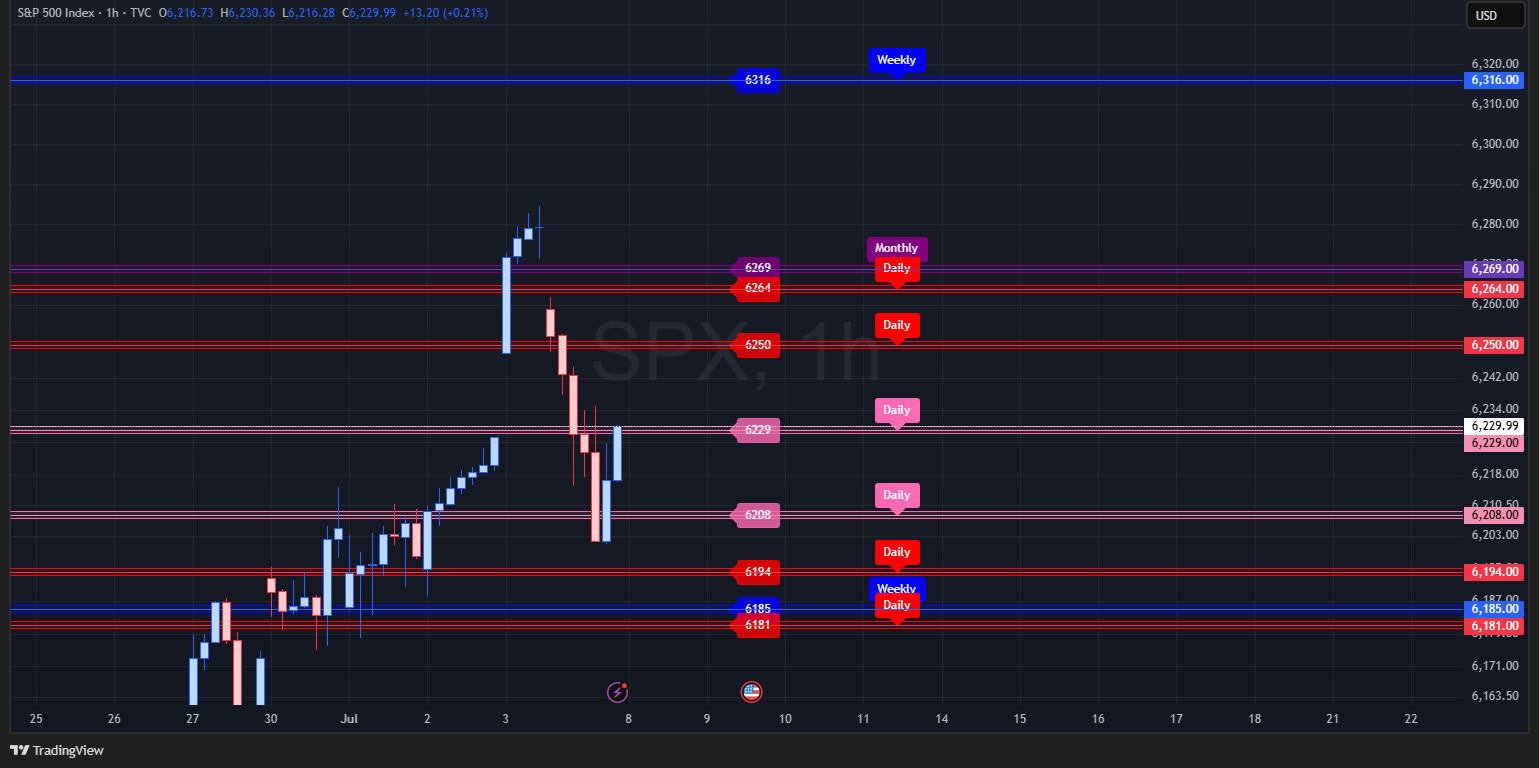
🎯 Daily SPX Levels:
6264-Red
6250-Red
6229-Pink
6208-Pink
6194-Red
6181-Red
🎯 Weekly SPX Levels:
6316-Blue
6185-Blue
🎯 July SPX Monthly Range:
6269, 5830-Purple
🎯 String Input: Copy and Paste this into the Indicator
6264,6250,6229,6208,6194,6181,6316,6185,6269,5830
Red and Pink Levels are updated Daily. (Daily Levels)
Blue Levels are updated Weekly before Mondays open. (Weekly Levels)
Purple Levels are updated beginning of each Month. (Monthly Range)
If necessary, I will provide additional daily levels in Substack’s chat thread to account for market gaps.
Levels Converted to ES Below:
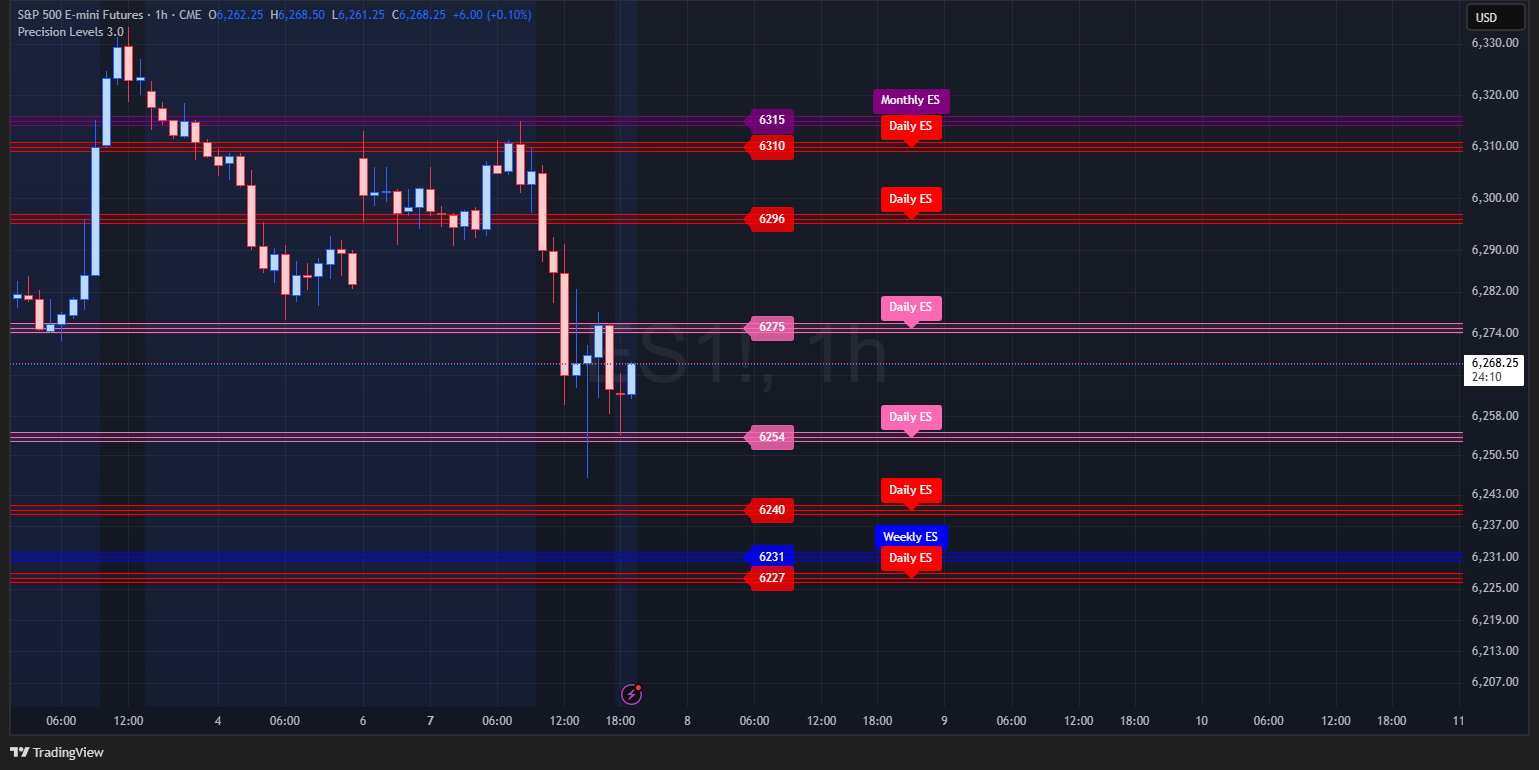
🎯 Daily ES Levels:
Manual ES Spread= 46
6310-Red
6296-Red
6275-Pink
6254-Pink
6240-Red
6227-Red
🎯 Weekly ES Levels:
6362-Blue
6231-Blue
Levels Converted to SPY Below:

🎯 Daily SPY Levels:
Manual SPY Ratio: 10.036
624.15-Red
622.76-Red
620.67-Pink
618.57-Pink
617.18-Red
615.88-Red
🎯 Weekly SPY Levels:
629.33-Blue
616.28-Blue
📣 Key News Events This Week:
But first here is how I treat news events. Rather than attempting to forecast where the market will head during these news events, I see them as moments when market algorithms swiftly push prices in their intended direction, regardless of the news itself. As traders, we can’t reliably predict how the market’s emotions will interpret good or bad news—sometimes it defies logic entirely. Good news might trigger sell-offs, while bad news could spark rallies. Instead of guessing, we should focus on reacting to live price action, letting it guide us based on how it aligns with our technical analysis.
Wednesday, July 9, 2025:
10:30 Crude Oil Inventories
13:00 10-Year Note Auction14:00 FOMC Meeting Minutes
Thursday, July 10, 2025:
08:30 Initial Jobless Claims
13:00 30-Year Bond Auction
📊 Here are charts of the larger patterns I’m watching below:
Hourly Chart From 7/6:
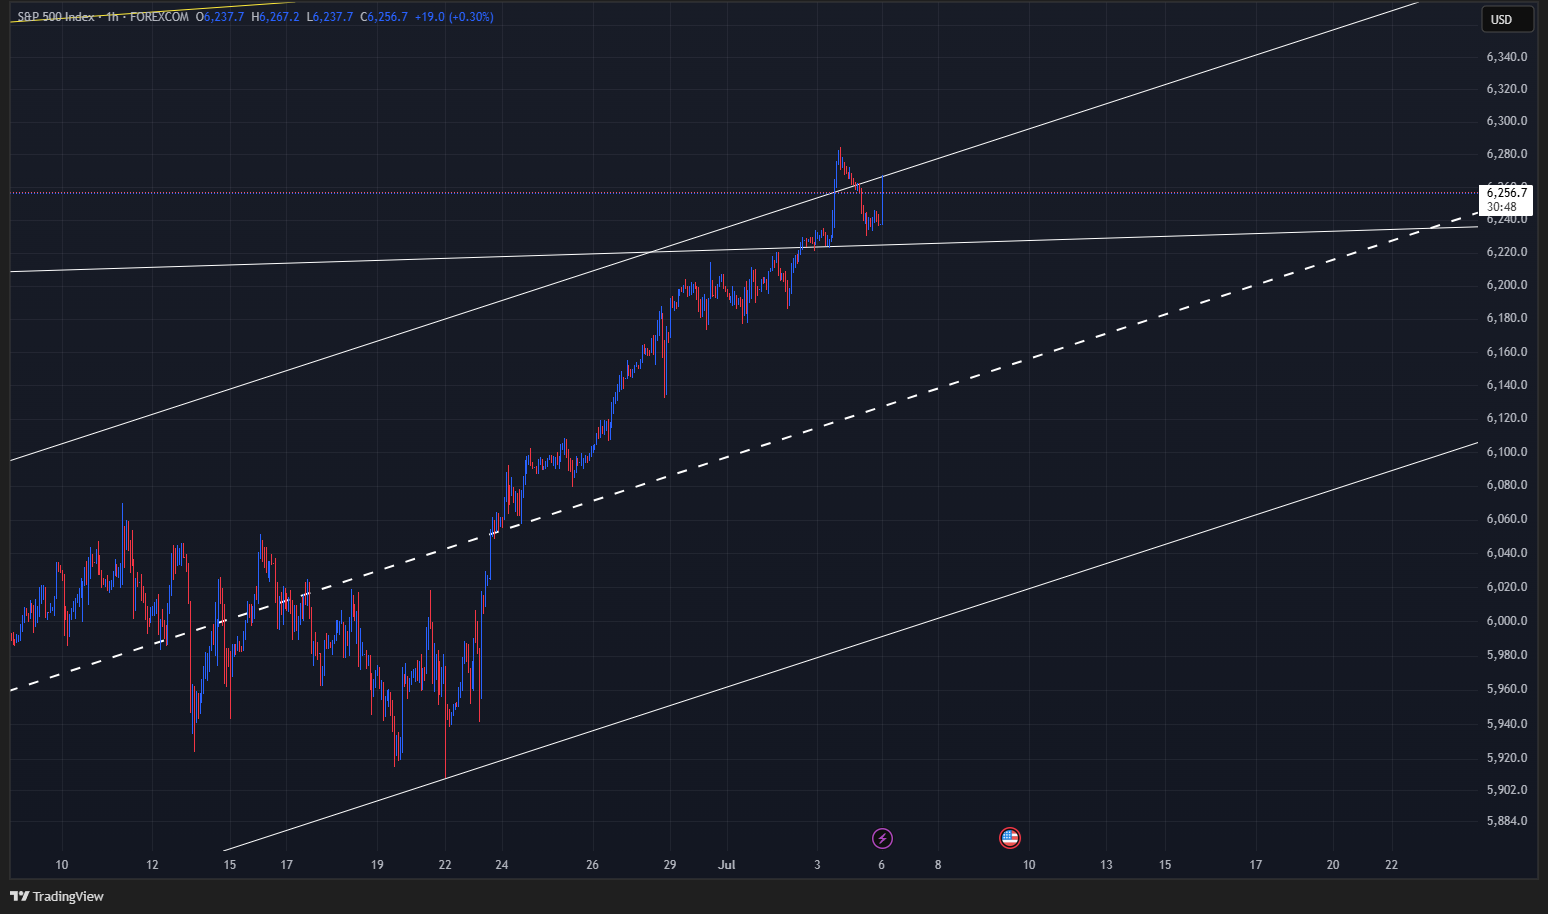
Daily Chart From 7/6:

Weekly Chart From 6/29: This is a weekly log scale chart of the S&P 500 dating back to 2009, which showcases its typical bullish pattern over the years. The chart indicates there’s still significant room for the price to move both upward and downward from its current level (Long Term). It’s common for analysts to predict market tops when new all-time highs are reached, but based on this long-term view, the market doesn’t appear overextended. A hidden trendline at 0.75 of the rising channel aligns with a level of 6,320 for July, offering a key reference point. When studying a channel, you can identify support and resistance at the top, middle, bottom, and even fractional increments in between. Additionally, there’s a yellow rising wedge pattern visible below, but the recent upward surge makes me question the reliability of the lower trendline, especially since the price has already broken through it once.

📣 Announcement:
Indicator Update: I’m thrilled to announce Precision Levels 3.0, an updated version of my custom indicator I’ve developed for Trading View, now available in the Community Scripts section! This tool is designed to streamline your charting by semi-automatically highlighting the key price levels I share, making it easier to track critical support, resistance, and breakout zones. Visit the link below for a step-by-step guide on how to find, set up, and use this indicator in your Trading View charts.

👇 Below are Hyperlinks to previous content shared in this newsletter. I recommend reading through all of it to better understand how to use this information to secure your edge:
Overview of the Quantitative Algorithm

Disclaimer
All content provided by Precision Levels SPX, including but not limited to website materials, social media posts, videos, charts, technical analysis, and other communications, is for informational and educational purposes only. It does not constitute financial, investment, trading, or professional advice of any kind. Precision Levels SPX is not a regist…