


SPX Daily Levels For Friday 6/27/2025 🎯
SPX support and resistance levels for Friday

A Small Favor That Makes a Big Difference
Thank you to all that shared my newsletter yesterday. I have had a recent uptick in reach and appreciate you!! If you’ve found value in what I share here, I’d be incredibly grateful if you could like, comment, or share these newsletters with others on your favorite platform. With my usual outreach cut off (thanks to X suspending my account), your support is more important than ever in helping this content reach new eyes.
Every interaction—no matter how small—reminds me that this work is worth continuing.
Thank you to those who’ve consistently shown up, and a special shoutout to everyone who’s pledged their support. I see you, and I appreciate you.
Levels for Friday are in the chart and listed below:

🎯 Daily SPX Levels:
6168-Red
6156-Red
6149-Pink
6136-Pink
6128-Red
6118-Red
🎯 Weekly SPX Levels:
6076-Blue
5880-Blue
🎯 June SPX Monthly Range:
6146-5615-Purple
Red and Pink Levels are updated Daily. (Daily Levels)
Blue Levels are updated Weekly before Mondays open. (Weekly Levels)
Purple Levels are updated beginning of each Month. (Monthly Range)
If necessary, I will provide additional daily levels in Substack’s chat thread to account for market gaps.
Levels Converted to ES Below:

🎯 Daily ES Levels:
We are now using September Contract.
Manual ES Spread=52
6220-Red
6208-Red
6201-Pink
6188-Pink
6180-Red
6170-Red
🎯 Weekly ES Levels:
6128-Blue
5928-Blue
Levels Converted to SPY Below:

🎯 Daily SPY Levels:
Manual SPY Ratio: 10.035
614.65-Red
613.45-Red
612.76-Pink
611.46-Pink
610.66-Red
609.67-Red
🎯 Weekly SPY Levels:
605.48-Blue
585.55-Blue
📣 Key News Events This Week:
But first here is how I treat news events. Rather than attempting to forecast where the market will head during these news events, I see them as moments when market algorithms swiftly push prices in their intended direction, regardless of the news itself. As traders, we can’t reliably predict how the market’s emotions will interpret good or bad news—sometimes it defies logic entirely. Good news might trigger sell-offs, while bad news could spark rallies. Instead of guessing, we should focus on reacting to live price action, letting it guide us based on how it aligns with our technical analysis.
Friday, June 27, 2025
08:30 – Core PCE Price Index
The recent U.S. airstrikes on Iran’s nuclear facilities have shocked global markets, introducing a fresh wave of uncertainty. While some may interpret the move as bullish—potentially paving the way for a more stable, nuclear-free Middle East—others worry it could spiral into broader conflict if Iran retaliates or other nations step in.
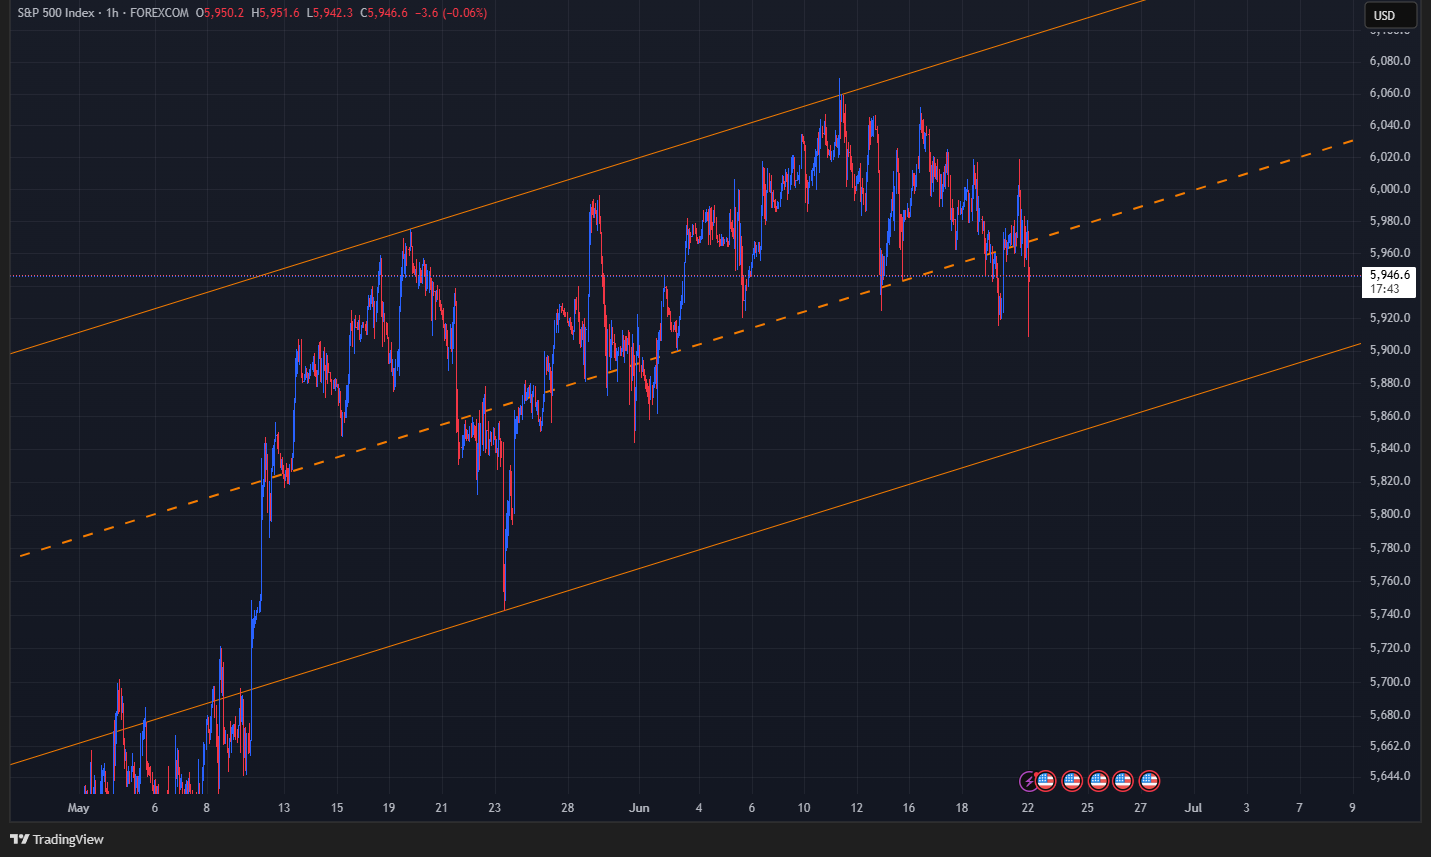
📊 Here are charts of the larger patterns I’m watching below:
Hourly Chart From 6/22: Friday Update: We reached the monthly range high at 6146 (Purple level) today, but price was rejected just before the cash close. This level was identified back on June 1st. 🎯. Based on my research, there’s a 63% probability we close the month below this level. From the bullish perspective, we’re just a few points away from new all-time highs. It’s also worth noting that month-end markup could still push a close above 6146. Any monthly trade targeting this level should now be approaching full profit, and traders may want to consider taking partial or full profits here. Channel resistance/now support is around 6120 all day Friday. That said, I don’t rely solely on trendlines—they’re just one piece of the puzzle I use to build confluence with my algorithmically driven support and resistance levels.
Daily Chart From 6/22:

Weekly Chart From 6/8: Rising wedge (yellow). This is concerning for the longer term (1-2years) bullish picture. A rising wedge typically signals a bearish reversal in an uptrend, with prices breaking below the lower trendline, targeting a decline equal to the wedge's height, though false breakouts or rare continuations can occur.

📣 Announcement:
Indicator Update: I’m thrilled to announce Precision Levels 2.0, an updated version of my custom indicator I’ve developed for Trading View, now available in the Community Scripts section! This tool is designed to streamline your charting by semi-automatically highlighting the key price levels I share, making it easier to track critical support, resistance, and breakout zones. Visit the link below for a step-by-step guide on how to find, set up, and use this indicator in your Trading View charts.

👇 Below are Hyperlinks to previous content shared in this newsletter. I recommend reading through all of it to better understand how to use this information to secure your edge:
Overview of the Quantitative Algorithm
A Day Traders Guide to Using Support and Resistance


Disclaimer
All content provided by Precision Levels SPX, including but not limited to website materials, social media posts, videos, charts, technical analysis, and other communications, is for informational and educational purposes only. It does not constitute financial, investment, trading, or professional advice of any kind. Precision Levels SPX is not a regist…
I preciate your work it very precise and helpful.
Thank you! You levels are spot on 🎯