
Precision Levels Colors 101
A simple guide to understanding what each color represents on the chart.

Every color on a Precision Levels chart has a specific role.
The colors help traders identify the timeframe behind each level, understand which areas are closest to price and organize what deserves attention during the session.
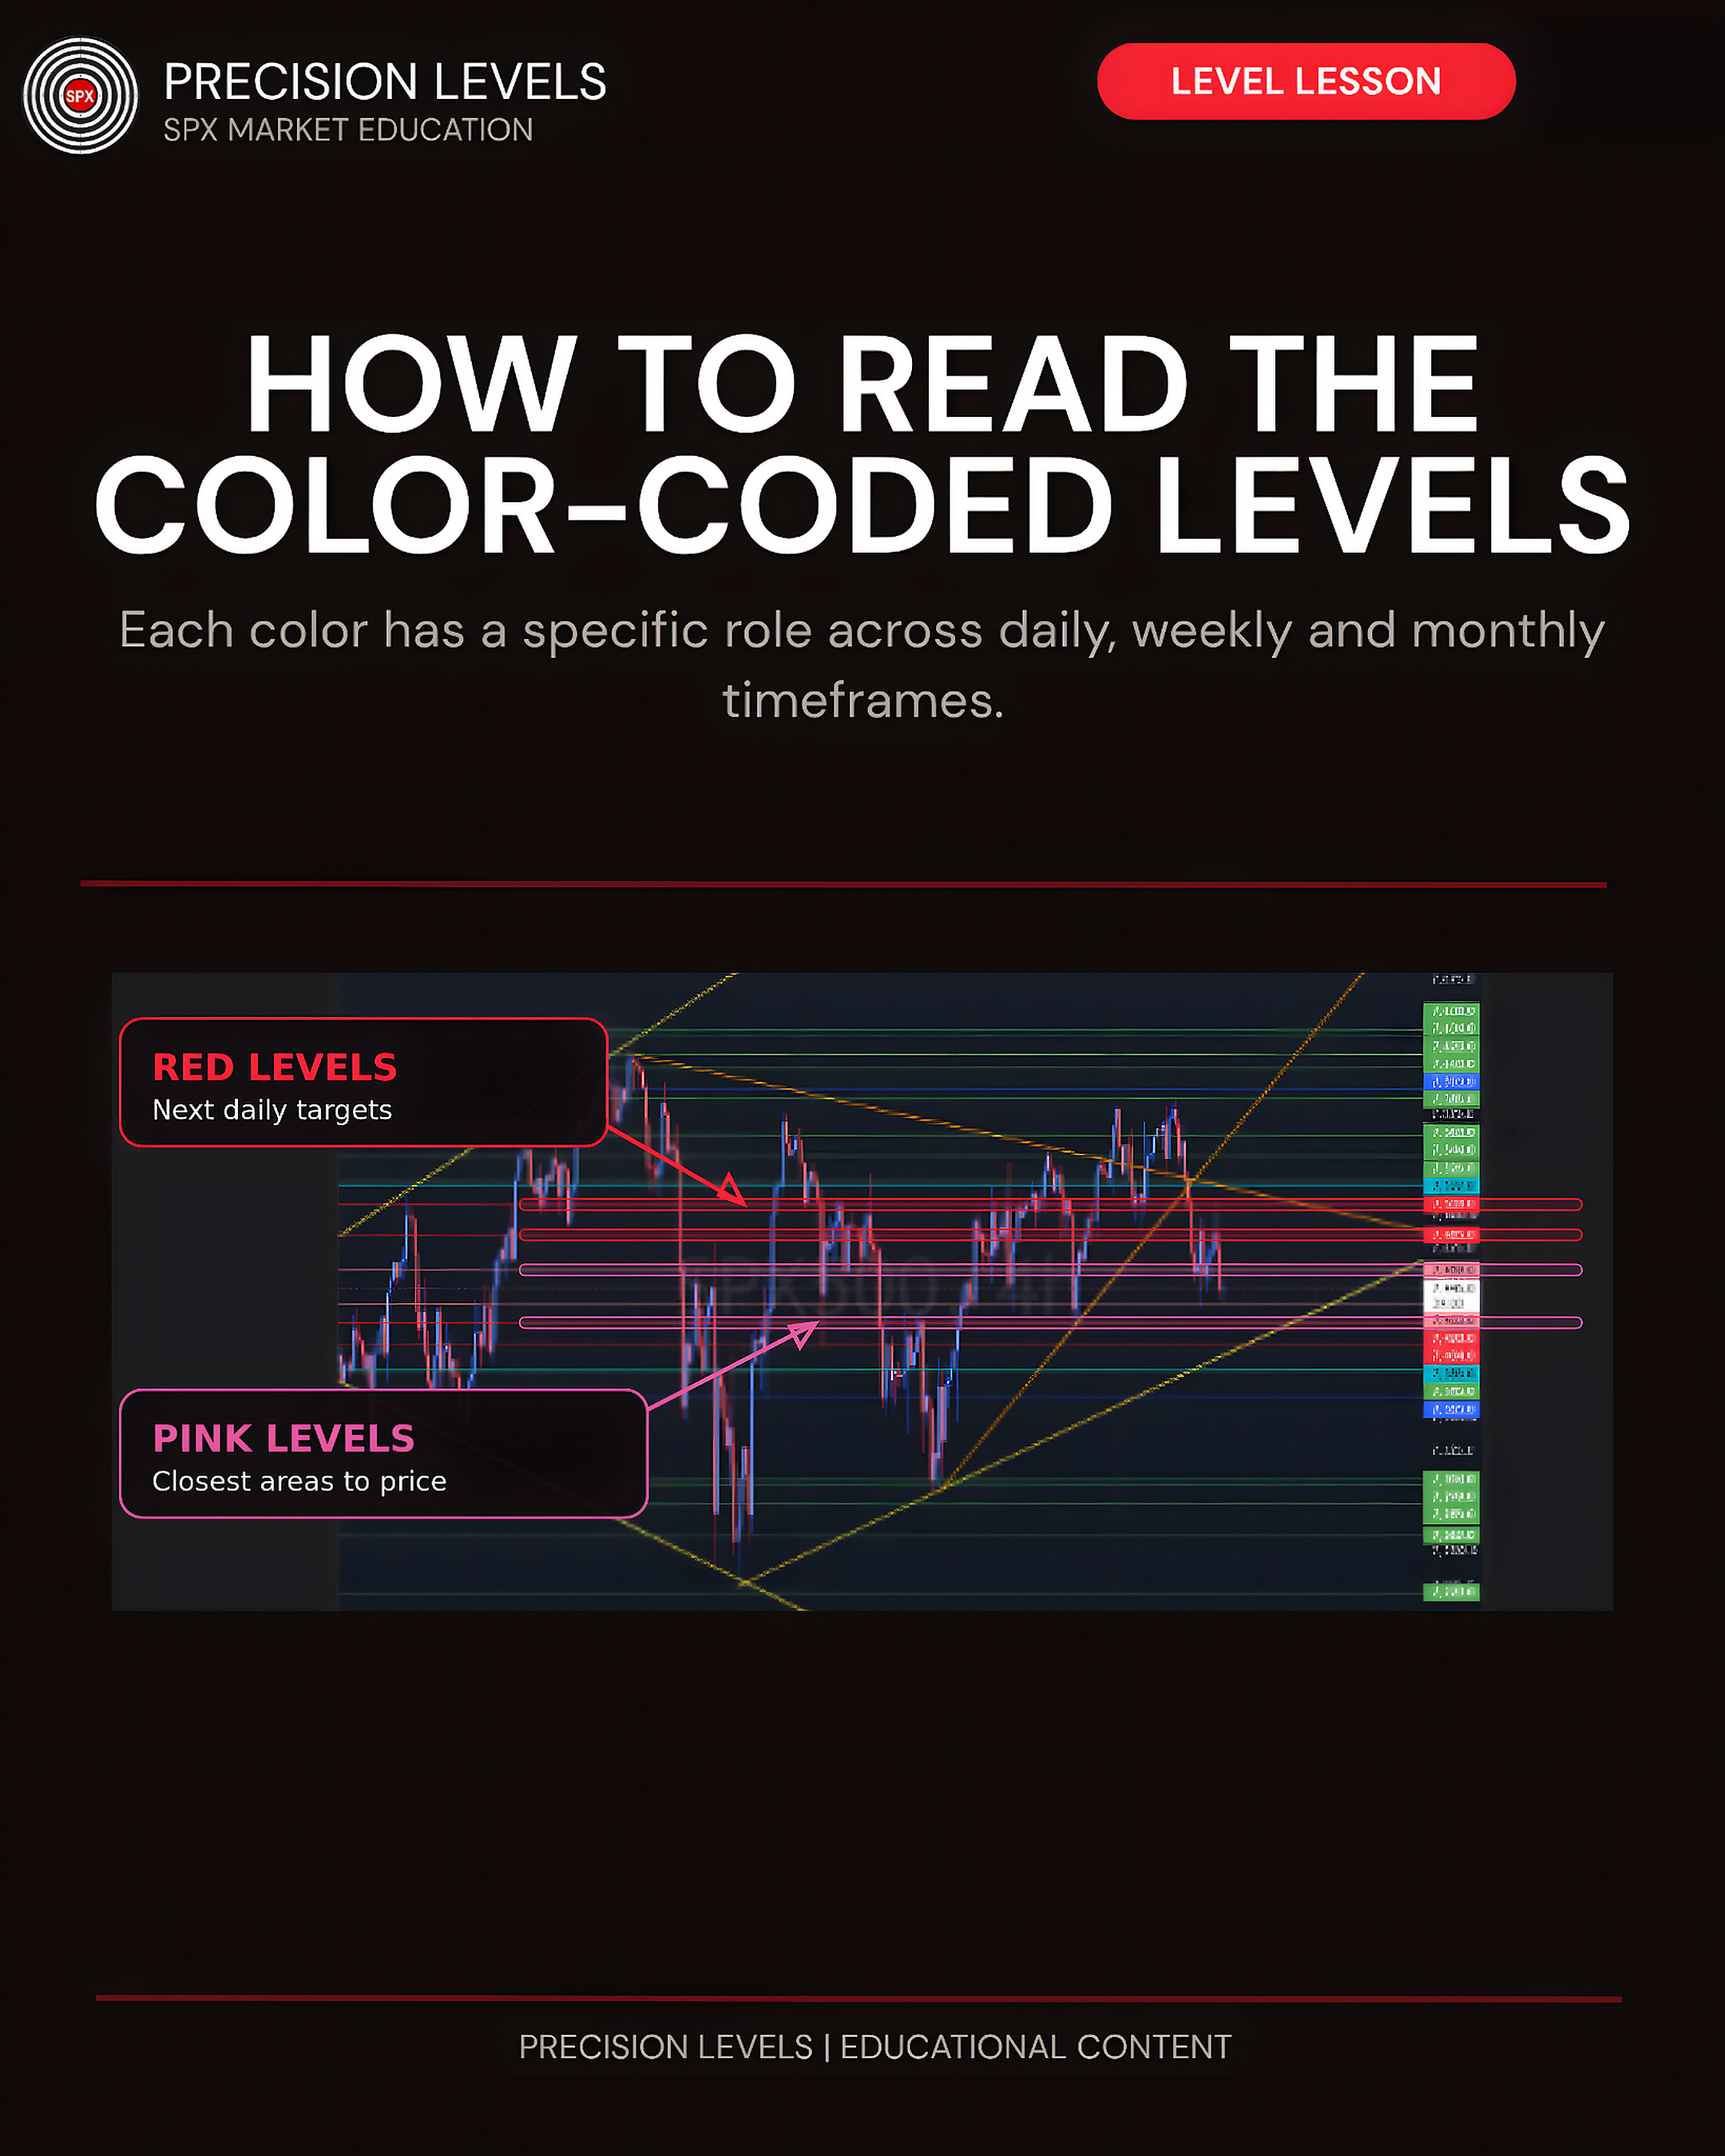
PINK AND RED
Pink marks the closest daily areas to price. These are often the first places traders watch for a reaction.
🔴 Red identifies the next daily targets when price begins moving beyond the nearest levels.
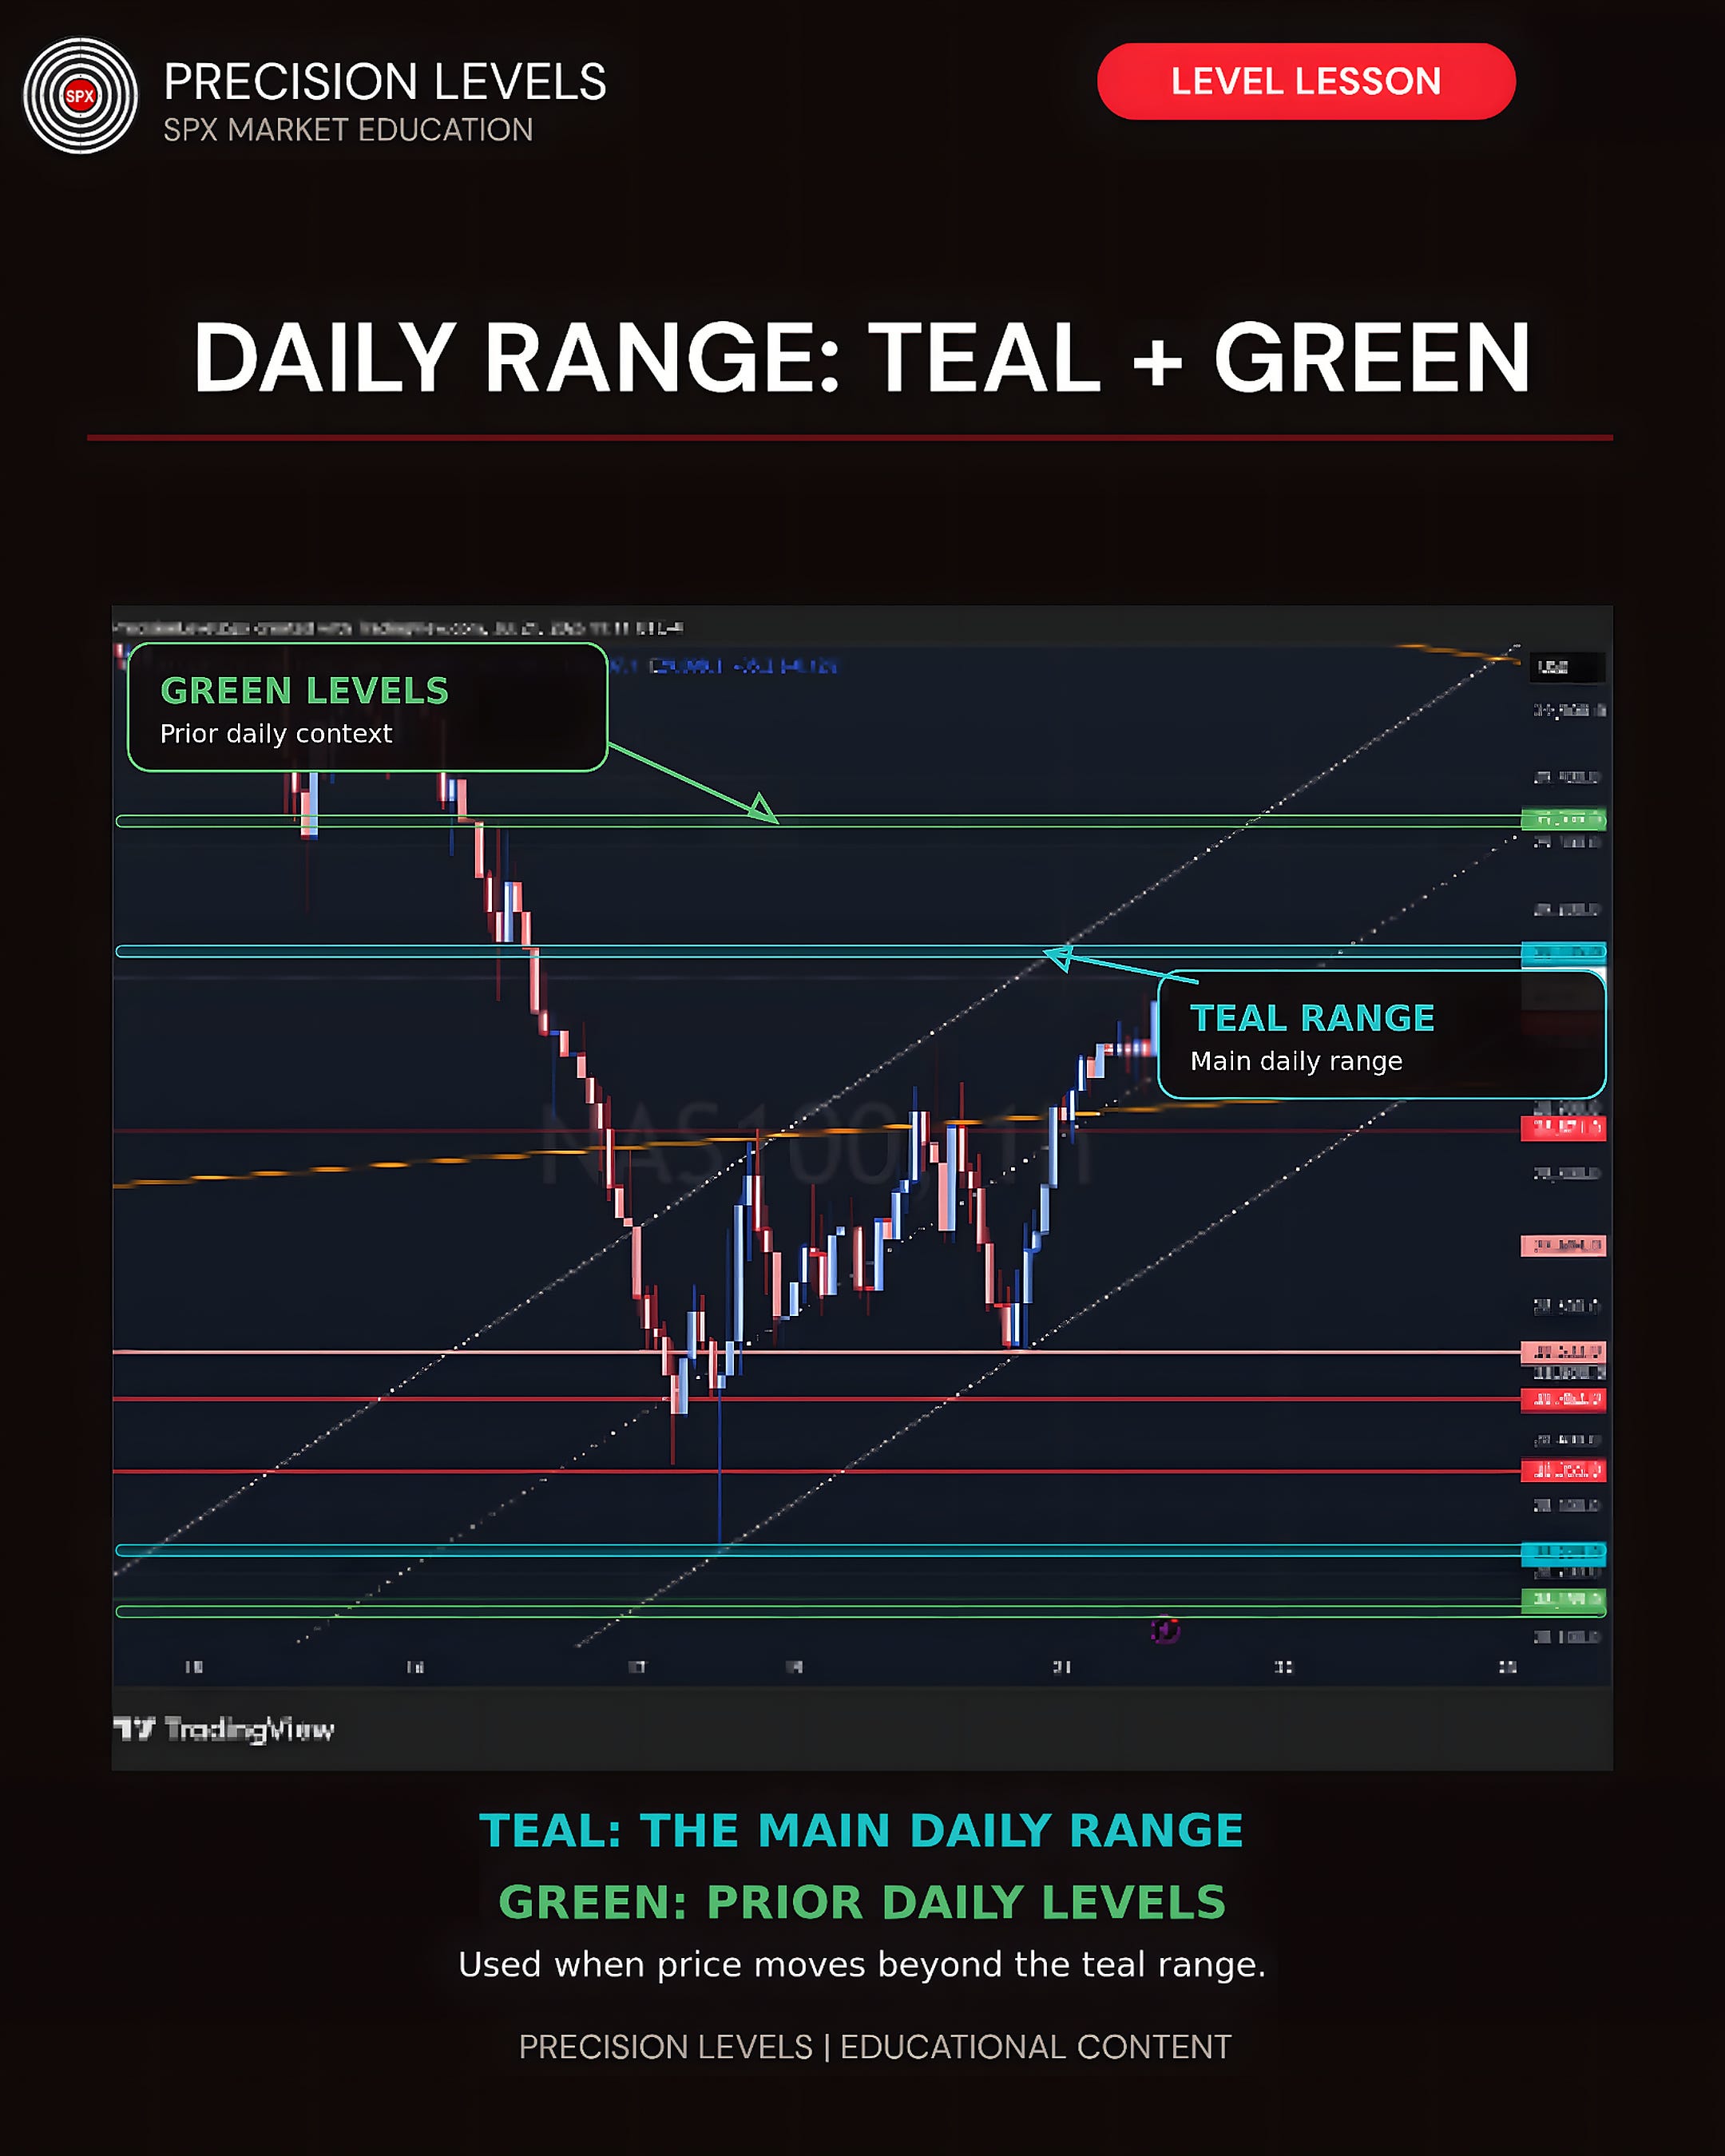
TEAL AND GREEN
Teal frames the main daily range.
🟢 Green provides prior daily context when price moves beyond the teal range.
THE COMPLETE COLOR GUIDE
Daily levels: Pink, Red, Teal and Green.
Weekly structure: Blue.
Monthly context: Purple.

The colors identify the timeframe and organize the areas worth watching. Price action still provides the evidence.
Now for the serious question: what’s your favorite color on the chart? 👇